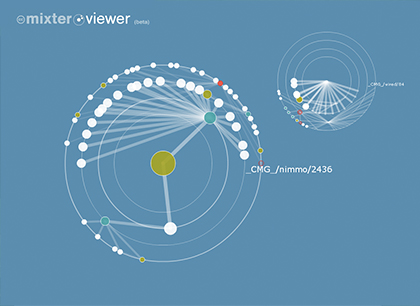
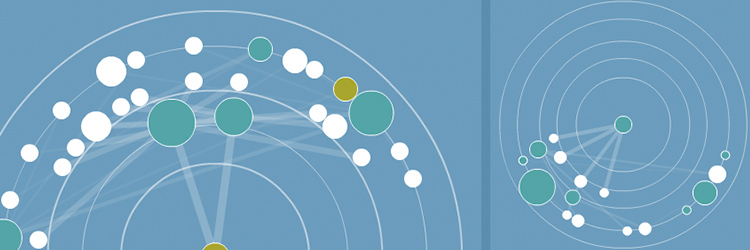
“A visualization of interconnectivity of the tracks within the ccMixter Creative Commons music and remixing site”

ccmixter.org is a “community music remixing site featuring remixes and samples licensed under Creative Commons licenses”.
In the November 2004 issue of WIRED magazine a CD was included (“The Wired CD”) which was a “collaborative effort between Wired magazine, Creative Commons, and sixteen musicians and groups”.

And “in 2005, Creative Commons and Wired Magazine launched The Fine Art of Sampling Contest in which contestants sampled the tracks from The Wired CD to create their own composition.” - wikipedia, The Wired CD
This was hosted on the ccMixter platform, and as this was a popular contest that spawned many remixes (and remixes of remixes, and remixes of remixes of remixes…) I became curious to visualize these 16 tracks as they were remixed through time.
Since a song on ccMixter can both use Creative Commons-licensed songs as source material (as well as allow others to use that song in their own work), the site’s songs naturally form a DAG (directed acyclic graph).
Each node is a track, with sampled sources forming parent nodes, and downstream songs that sample it forming children nodes.
I visualized and designed a circular DAG representation that would plot a track in the center point, the tracks that were used as sources in the top hemisphere, and tracks that remixed the center track in the lower hemisphere. Further I represented the number of ‘hops’ away from the current track/node as concentric circles.
Clicking on a node would play the track, and double-clicking on the node would recenter that track to be the center node in the DAG.
Unfortunately I never formally published this unique song browser.

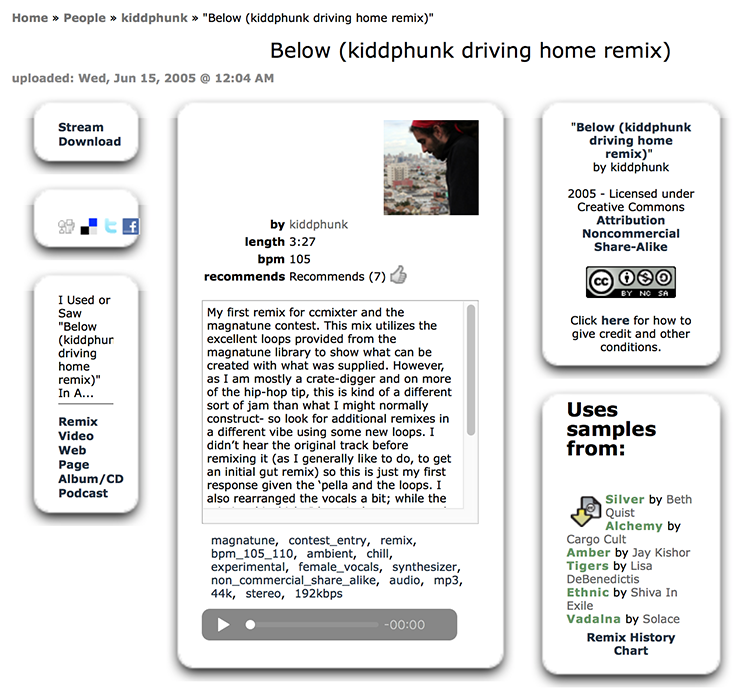
Also in 2005 I contributed a remix “Below” that utilized six sample sources from the Magnatune library:


