|
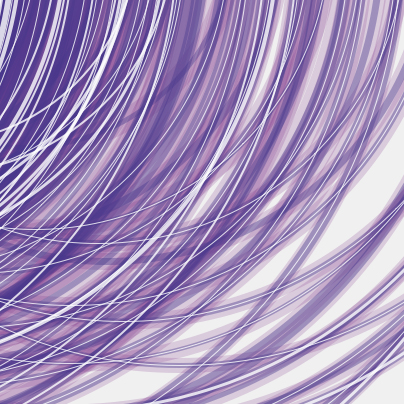
To correct the asymmetry present in the color coding of the arcs (left->right relationships), I decided to remove the top graph altogether and replace it with the inverse linkages of the bottom (right->left relationships).
Having a balanced top-bottom allows for yin-yang symmetries to form in the natural interlock of sub-users-in-common and their respective link-space influences.
By varying the arc widths and color the same data can be contained as in the stacked-pixel graph (although abstractly).
The basic method I used for these particular renderings in this section often ignores the blue realm of the previous graphs, the "middle-ground", in order to more clearly view the opposite extreme ends of the link-spaces.
|
Figure 04.02 shows the intersection of several users; this view shows just where the primary users themselves appear on each others' graphs.
The radius is 1 pixel/link and the red/orange/grey values should be viewed in an additive sense (that is, the 'width' of a colored band should be read from the end of the previous color band); no data is contained in the alphas. The coloration
formula follows that of the graphs from the previous section.
In this example, the arcs can be read quickly to ascertain that kiddphunk and quarket share a large amount of red-links, but not many greys.
Quite a different pattern is seen between kiddphunk and angusf (off-screen), who overlap in a large amount of greys, a few oranges and no reds.
|
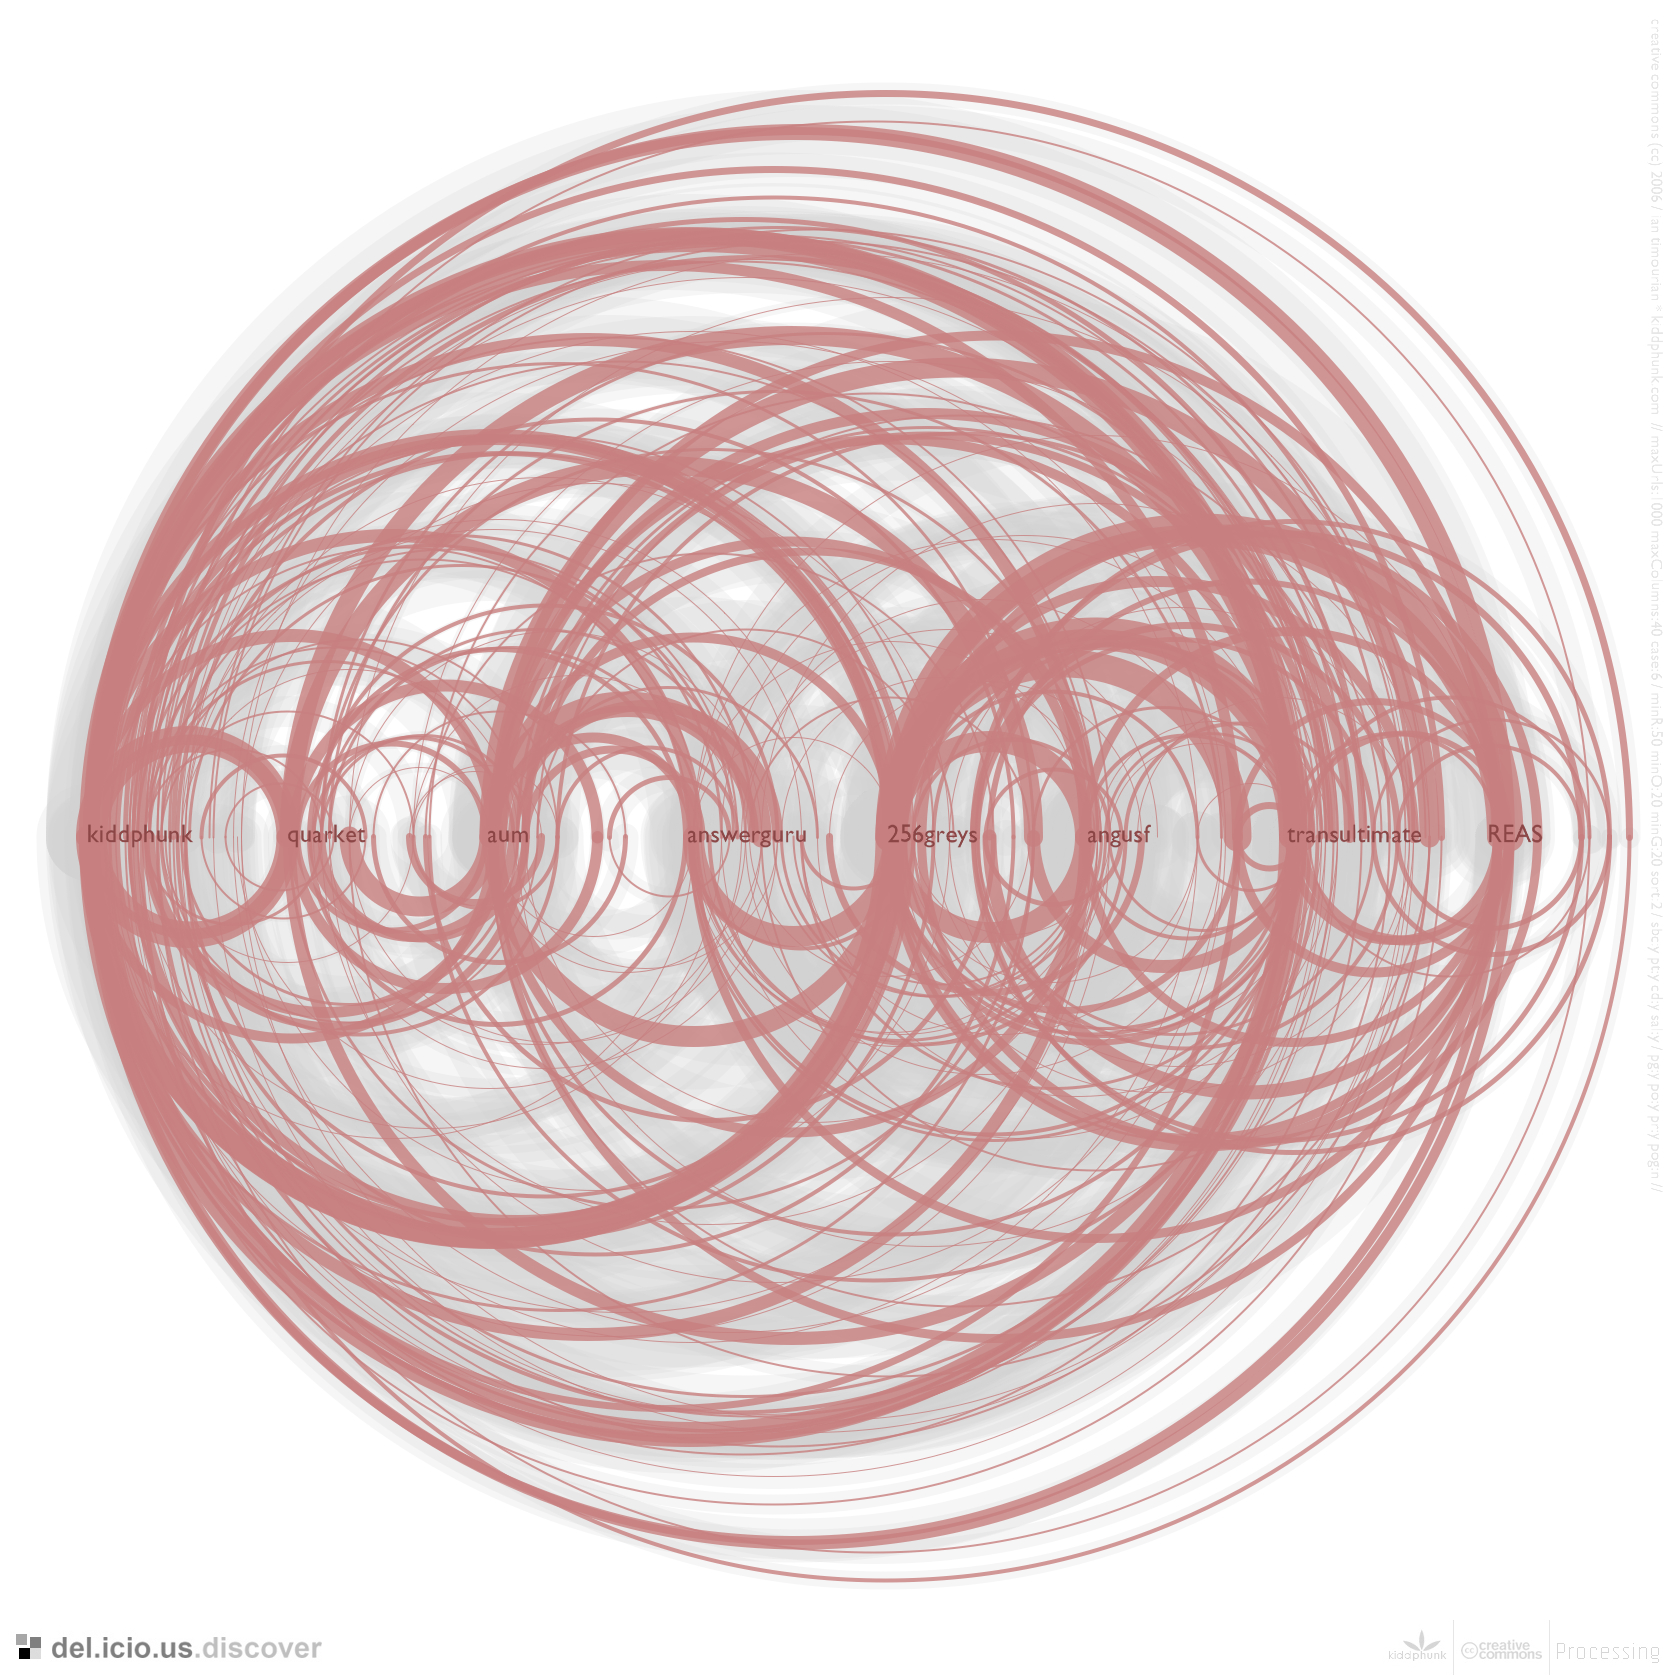
These two renderings show 4 and 8 users, each with a 40 column graph. The arcs contain all links, as the coloration rule used covers all popularity values:
grey = (P > 10)
red = (P <= 10)
|
Figure 04.04 illustrates where the 8 primary users connect to one another; only connections between adjacent user graphs are shown.
|
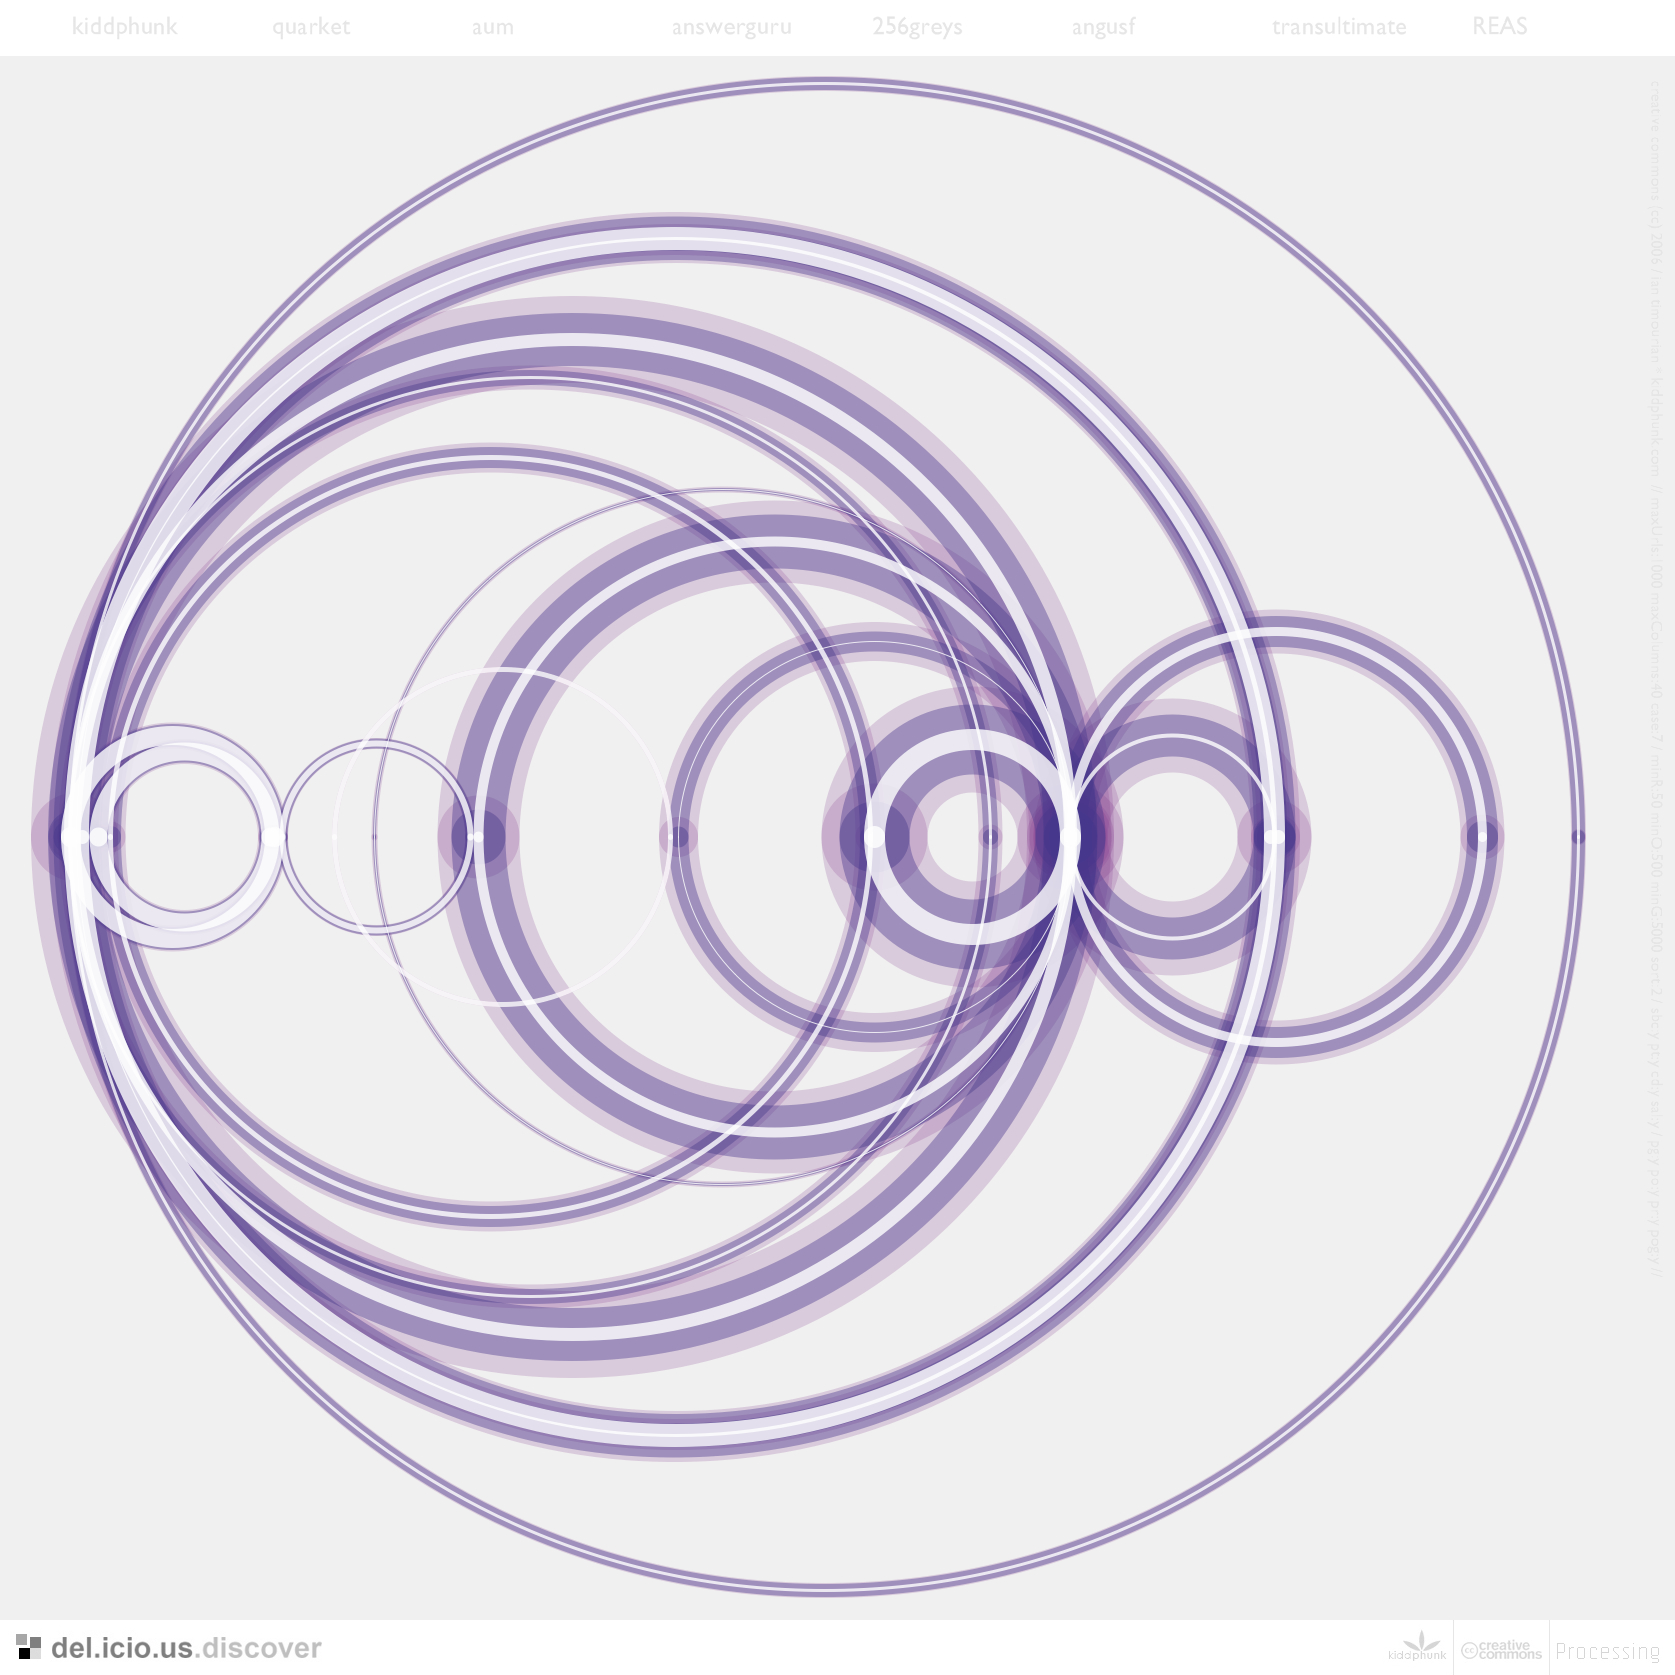
Figure 04.05 goes further and graphs the full set of primary connections (top) and the set of all connections (bottom).
|
The coloration rule utilized by these three graphs is:
grey = (P > 5000)
blue = (50 < P <= 500)
[white] = (P <= 50)
|
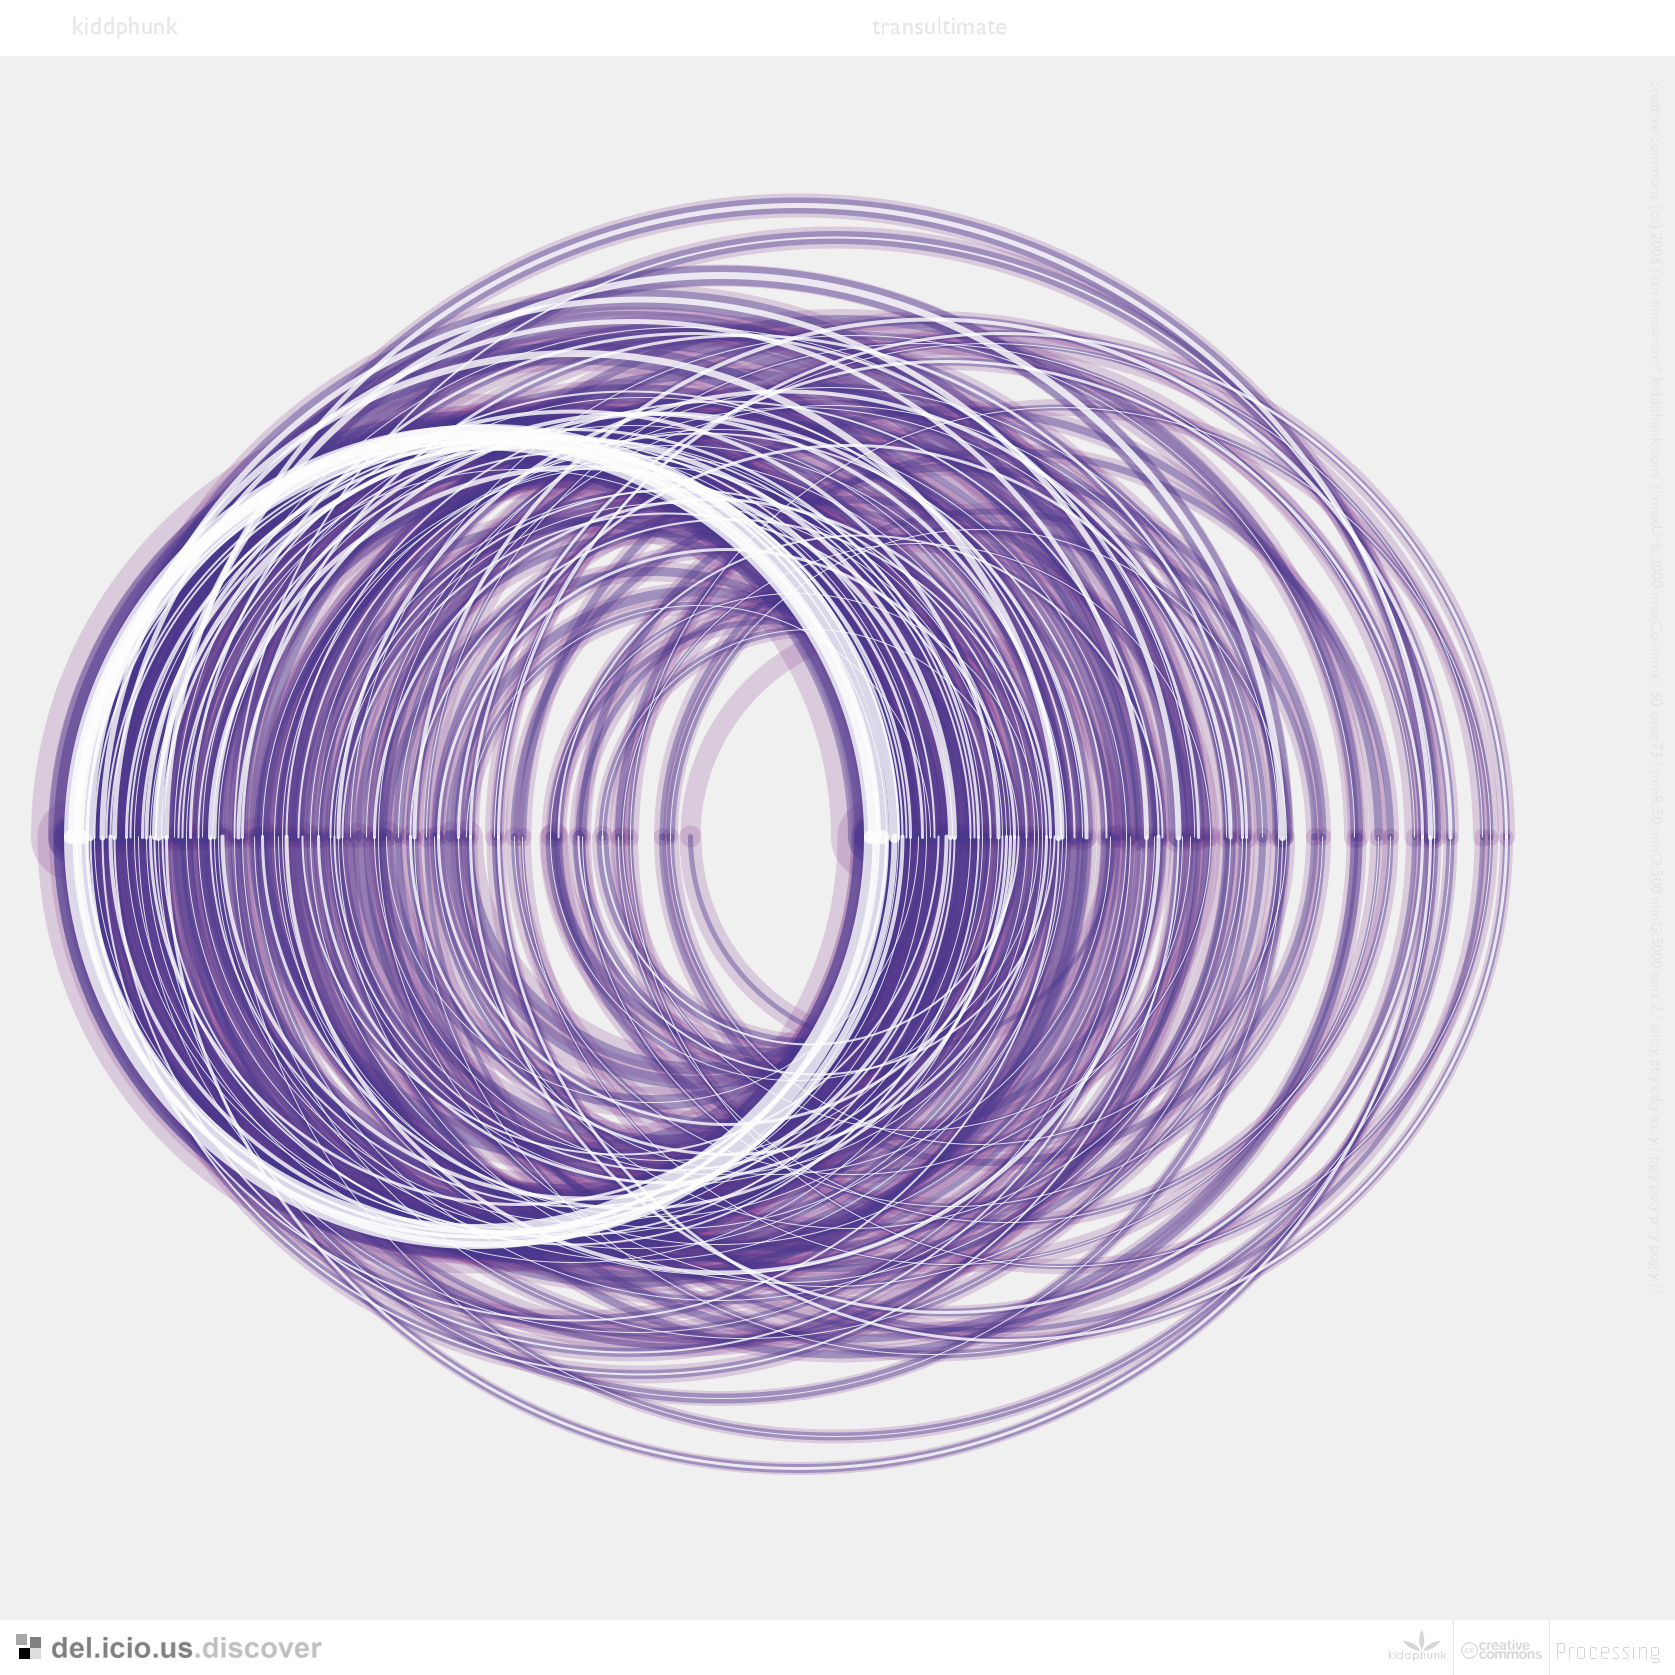
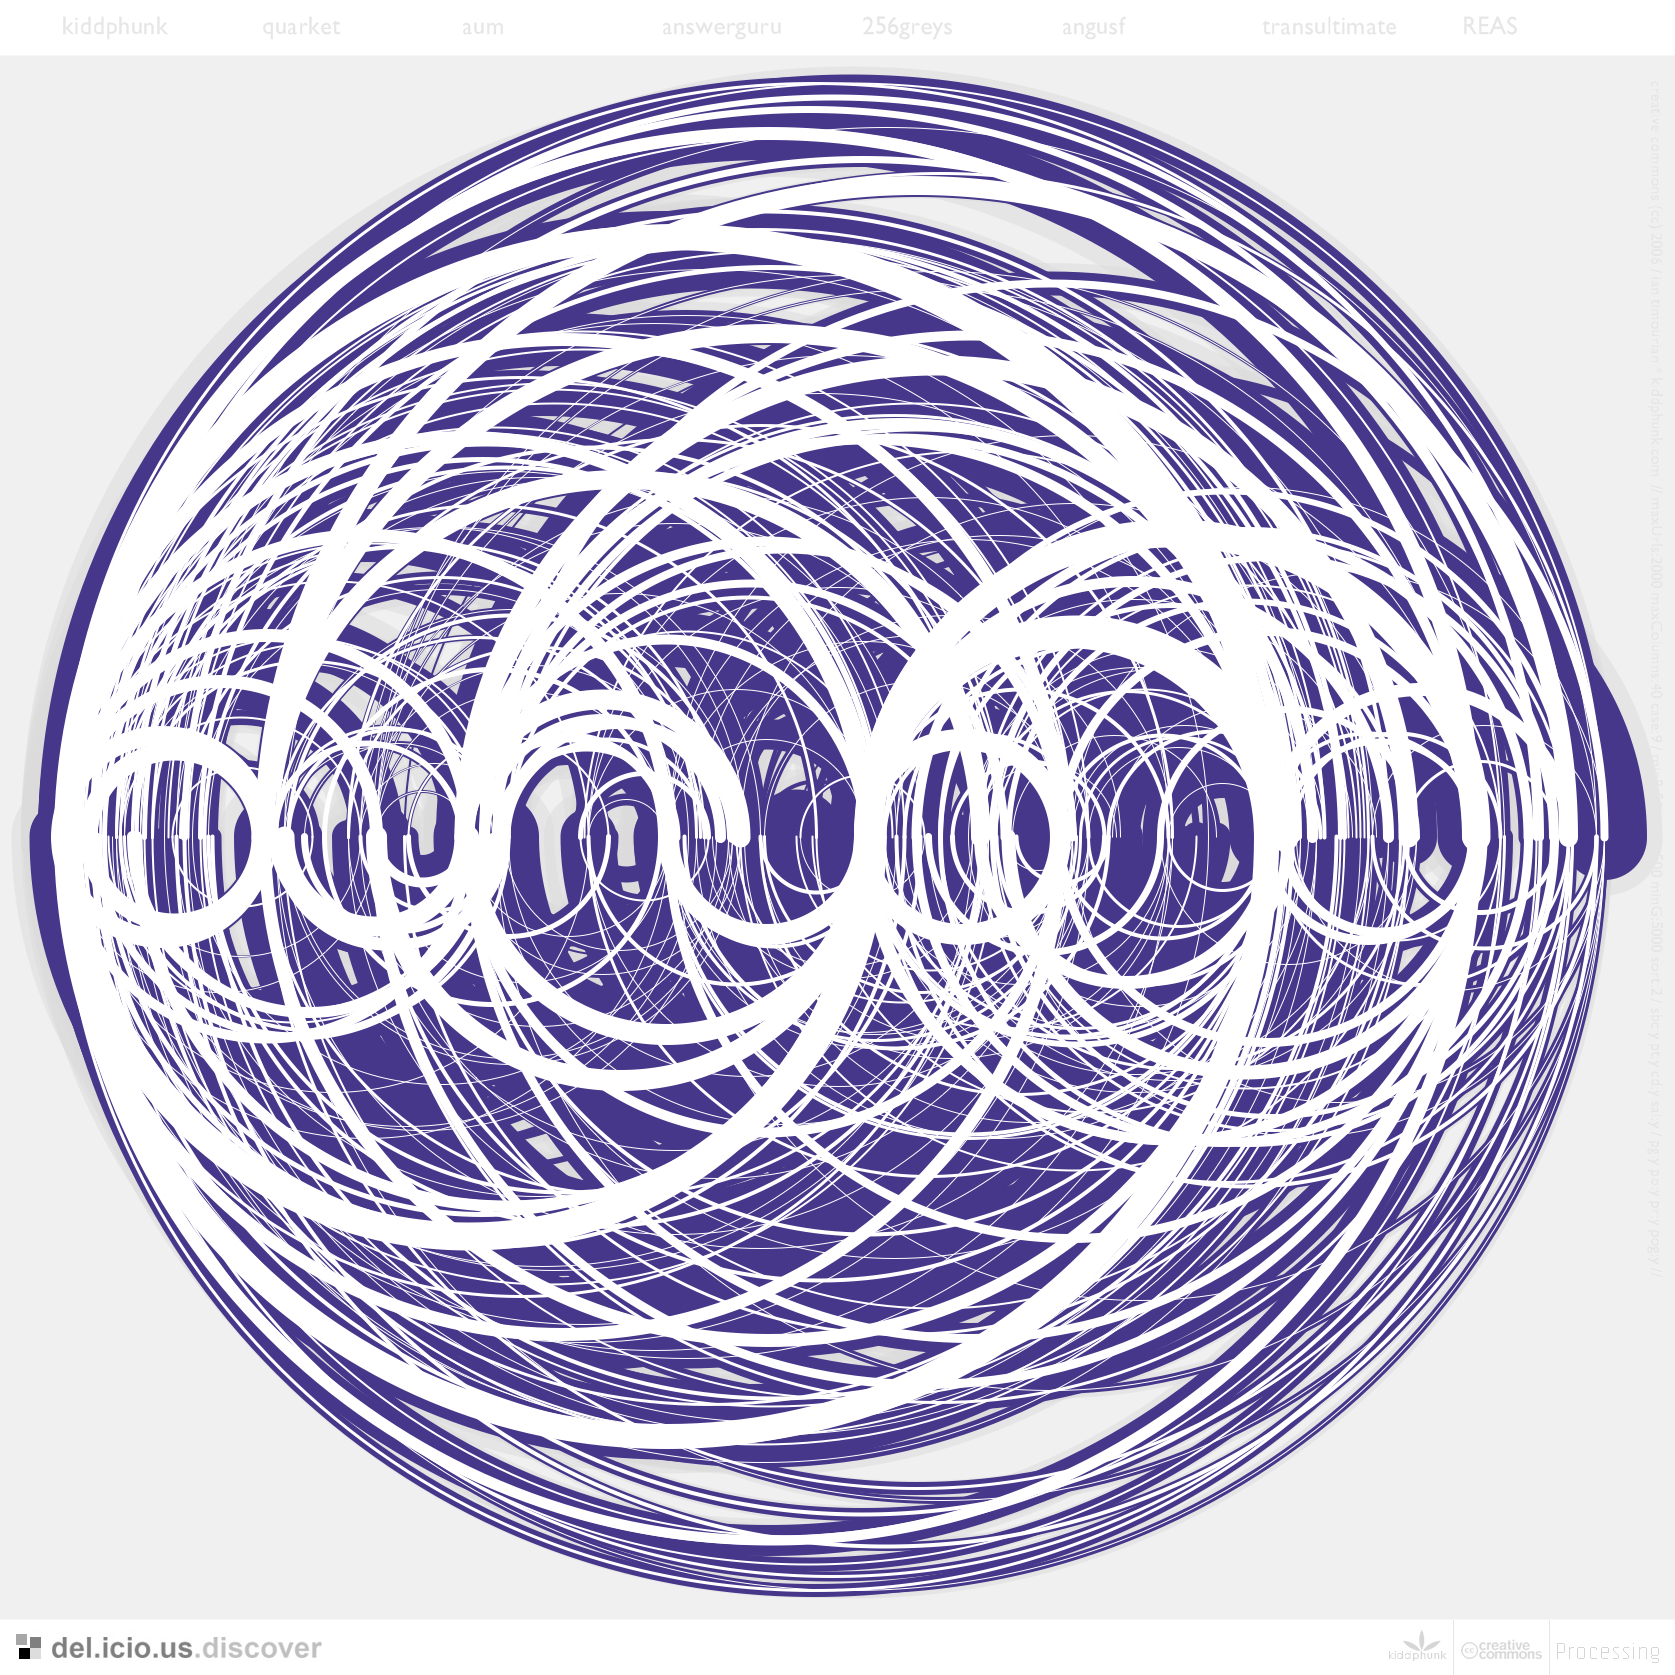
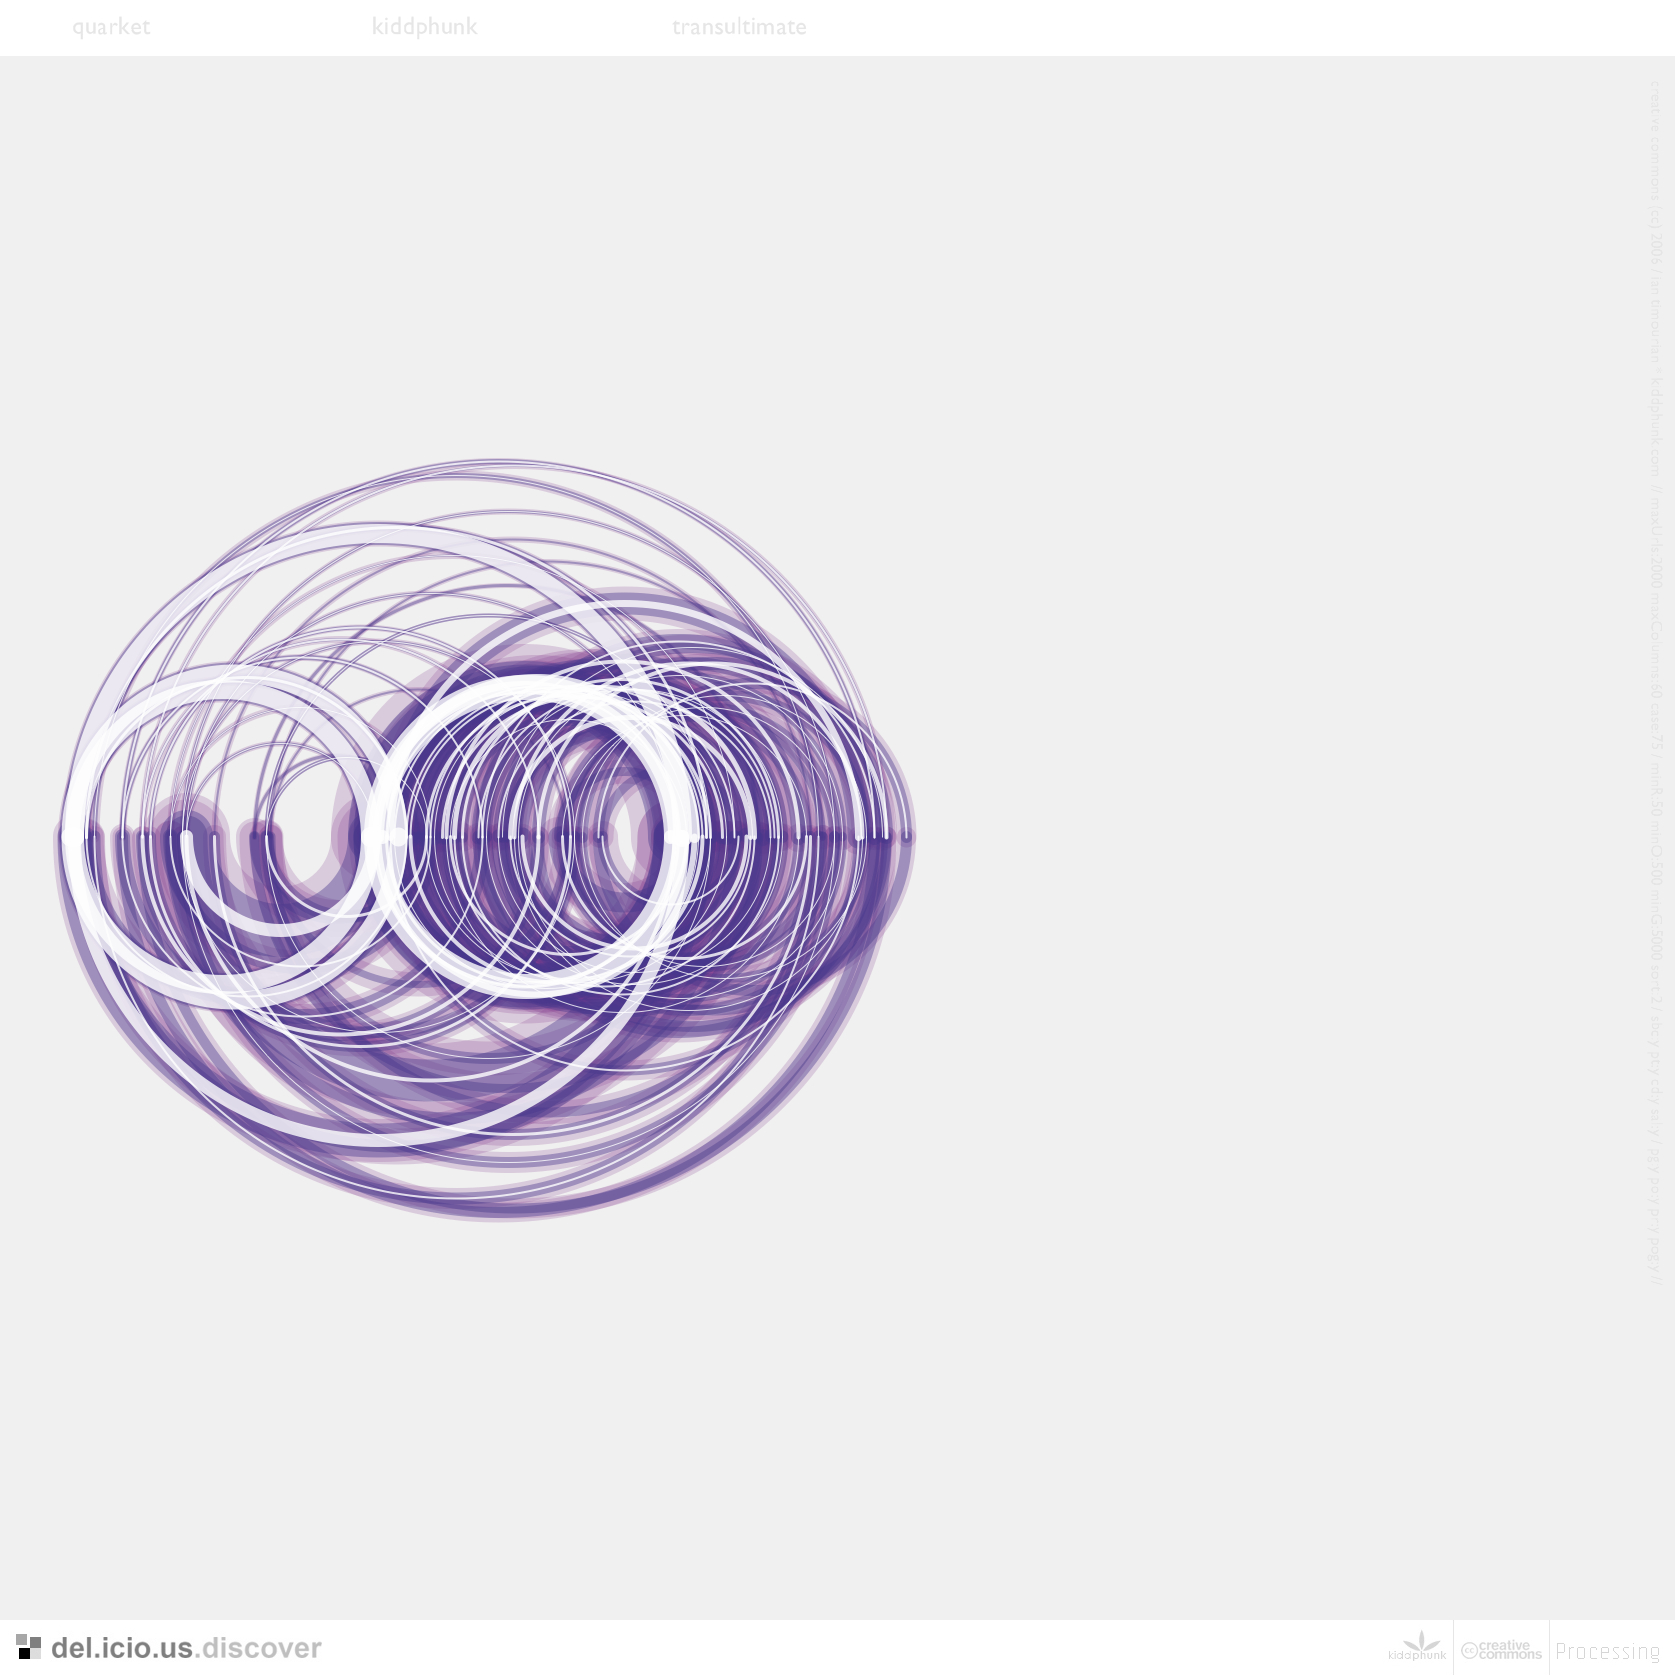
The top hemisphere of a tri-graph visualization (of quarket, kiddphunk, transultimate) is seen in Figure 04.06, above.
The coloration rule utilized by these final graphs remains the same as the previous set; the coloration has however shifted to a purple/blue/white palette with highly transparent arc coloring.
Further explorations may include larger dataset renderings (16-user graphs), more precisely-focused ones (8-user graphs between a primary user and their "top 7") or investigating
ways to show the "overlap" more richly (how every column intersects with another users' link-space).
|
This simple exploration has looked into the connections that arise between a small number of people on del.icio.us, providing a rich set of behaviors, patterns and inter-linkings
that are as beautiful to behold in the eye as they are when absorbing what these links, flows and relations represent in non-visual terms.
Footprints and reflections from a global mind learning to work with new forms of input/output, shaping the freedom and flow of information in real-time, utilizing the ever-expanding wave of knowledge individually and collectively.
|
Above (clockwise from bottom-left):
connections between 8 primary users
a detailed pair of graphs (kiddphunk and transultimate)
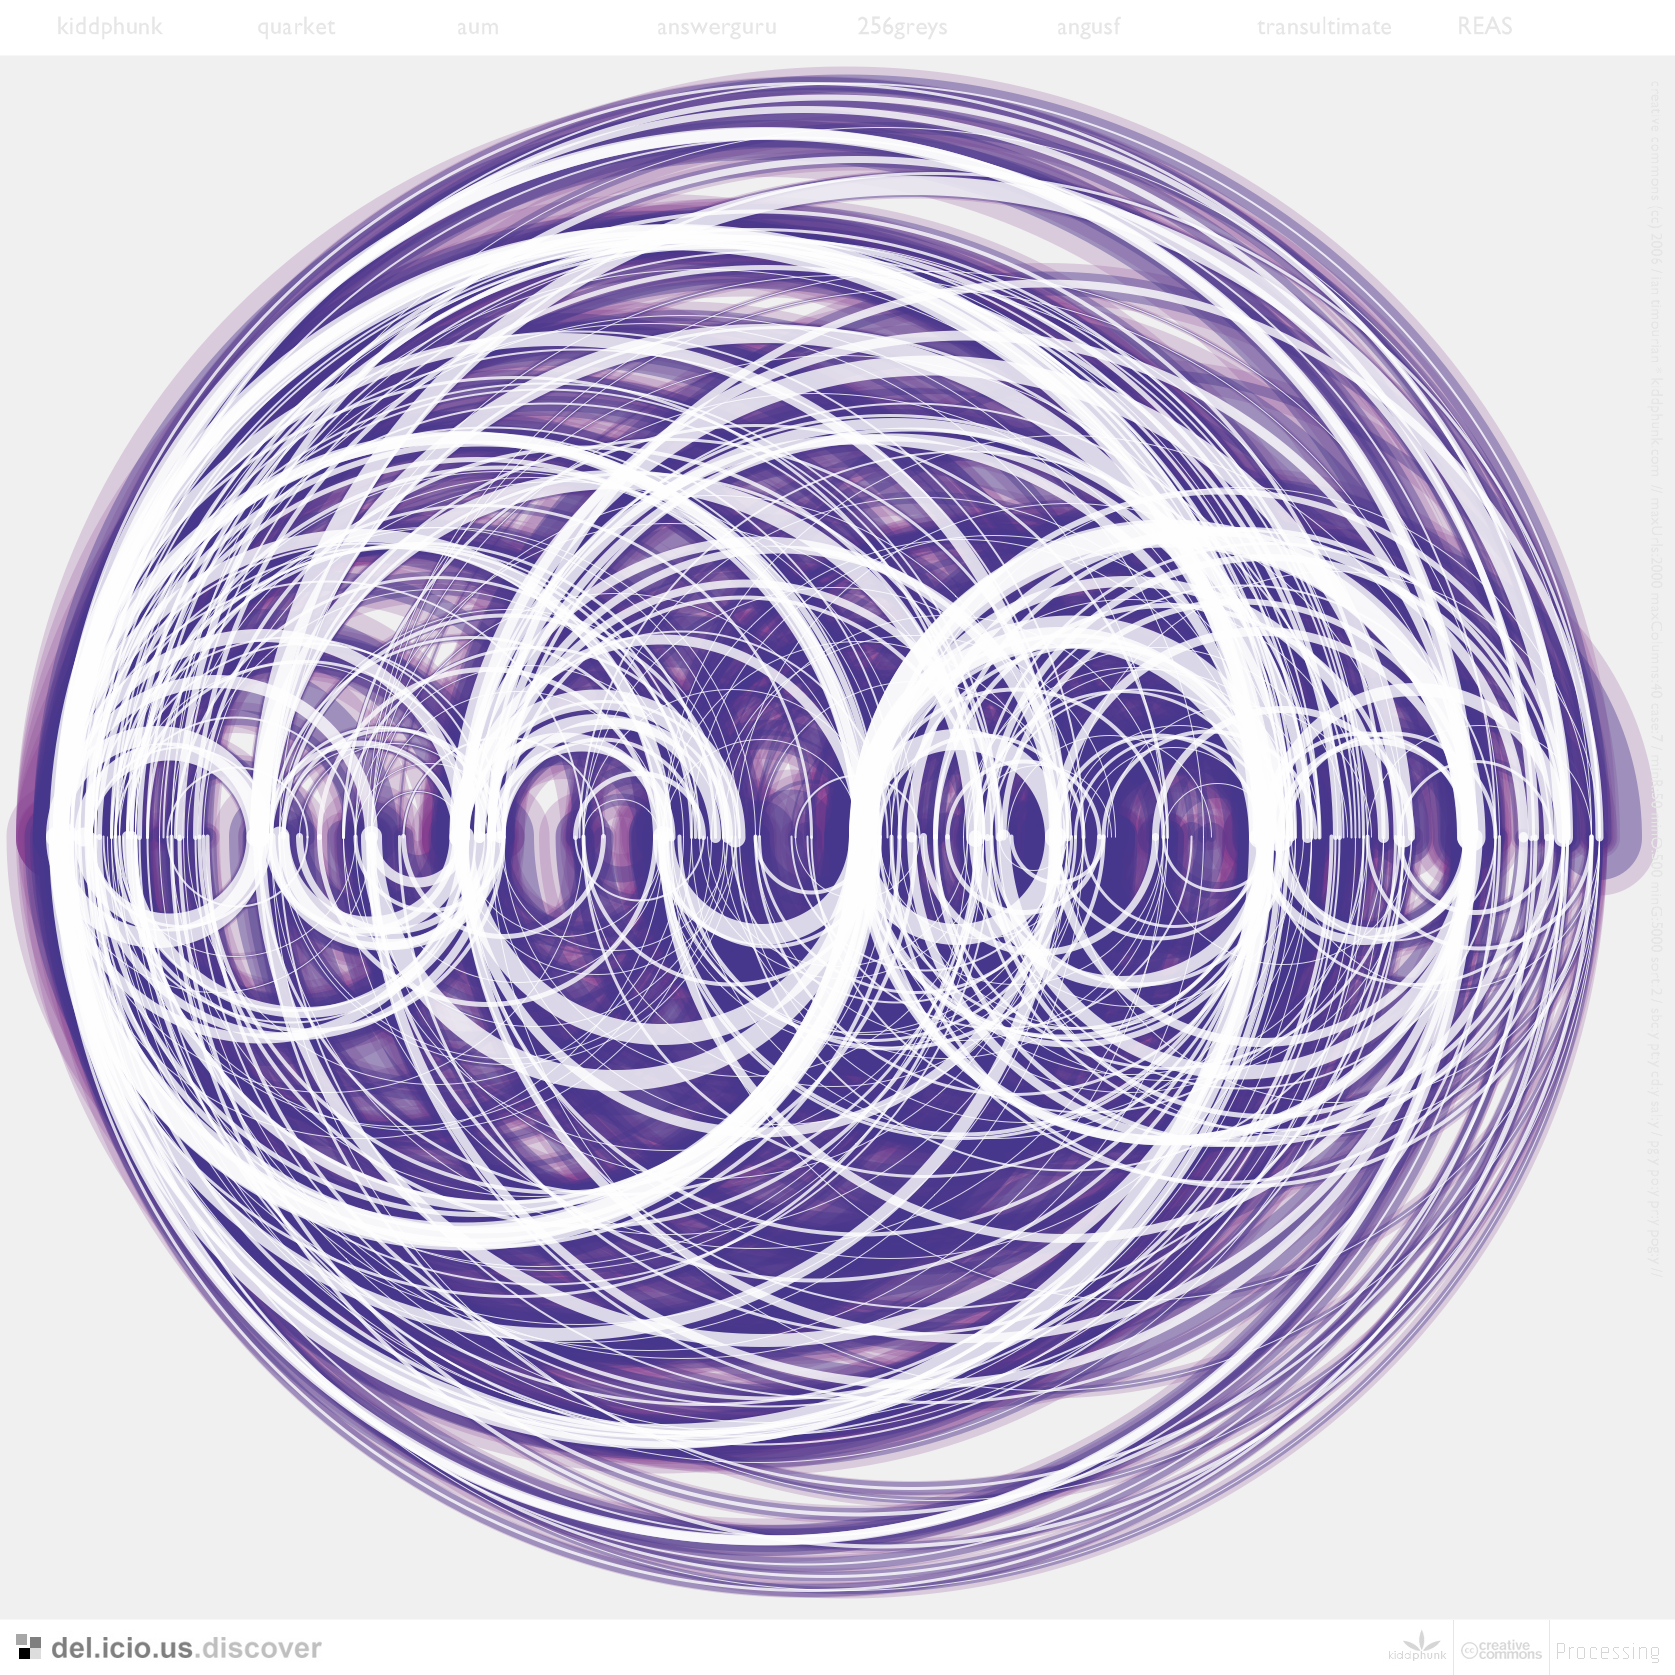
record/grooves effect created by using two mirrored kiddphunk graphs
full purple/translucent version of the 8-user link-space
Continue on to part 05 | Recommendations |
 04.01
04.01 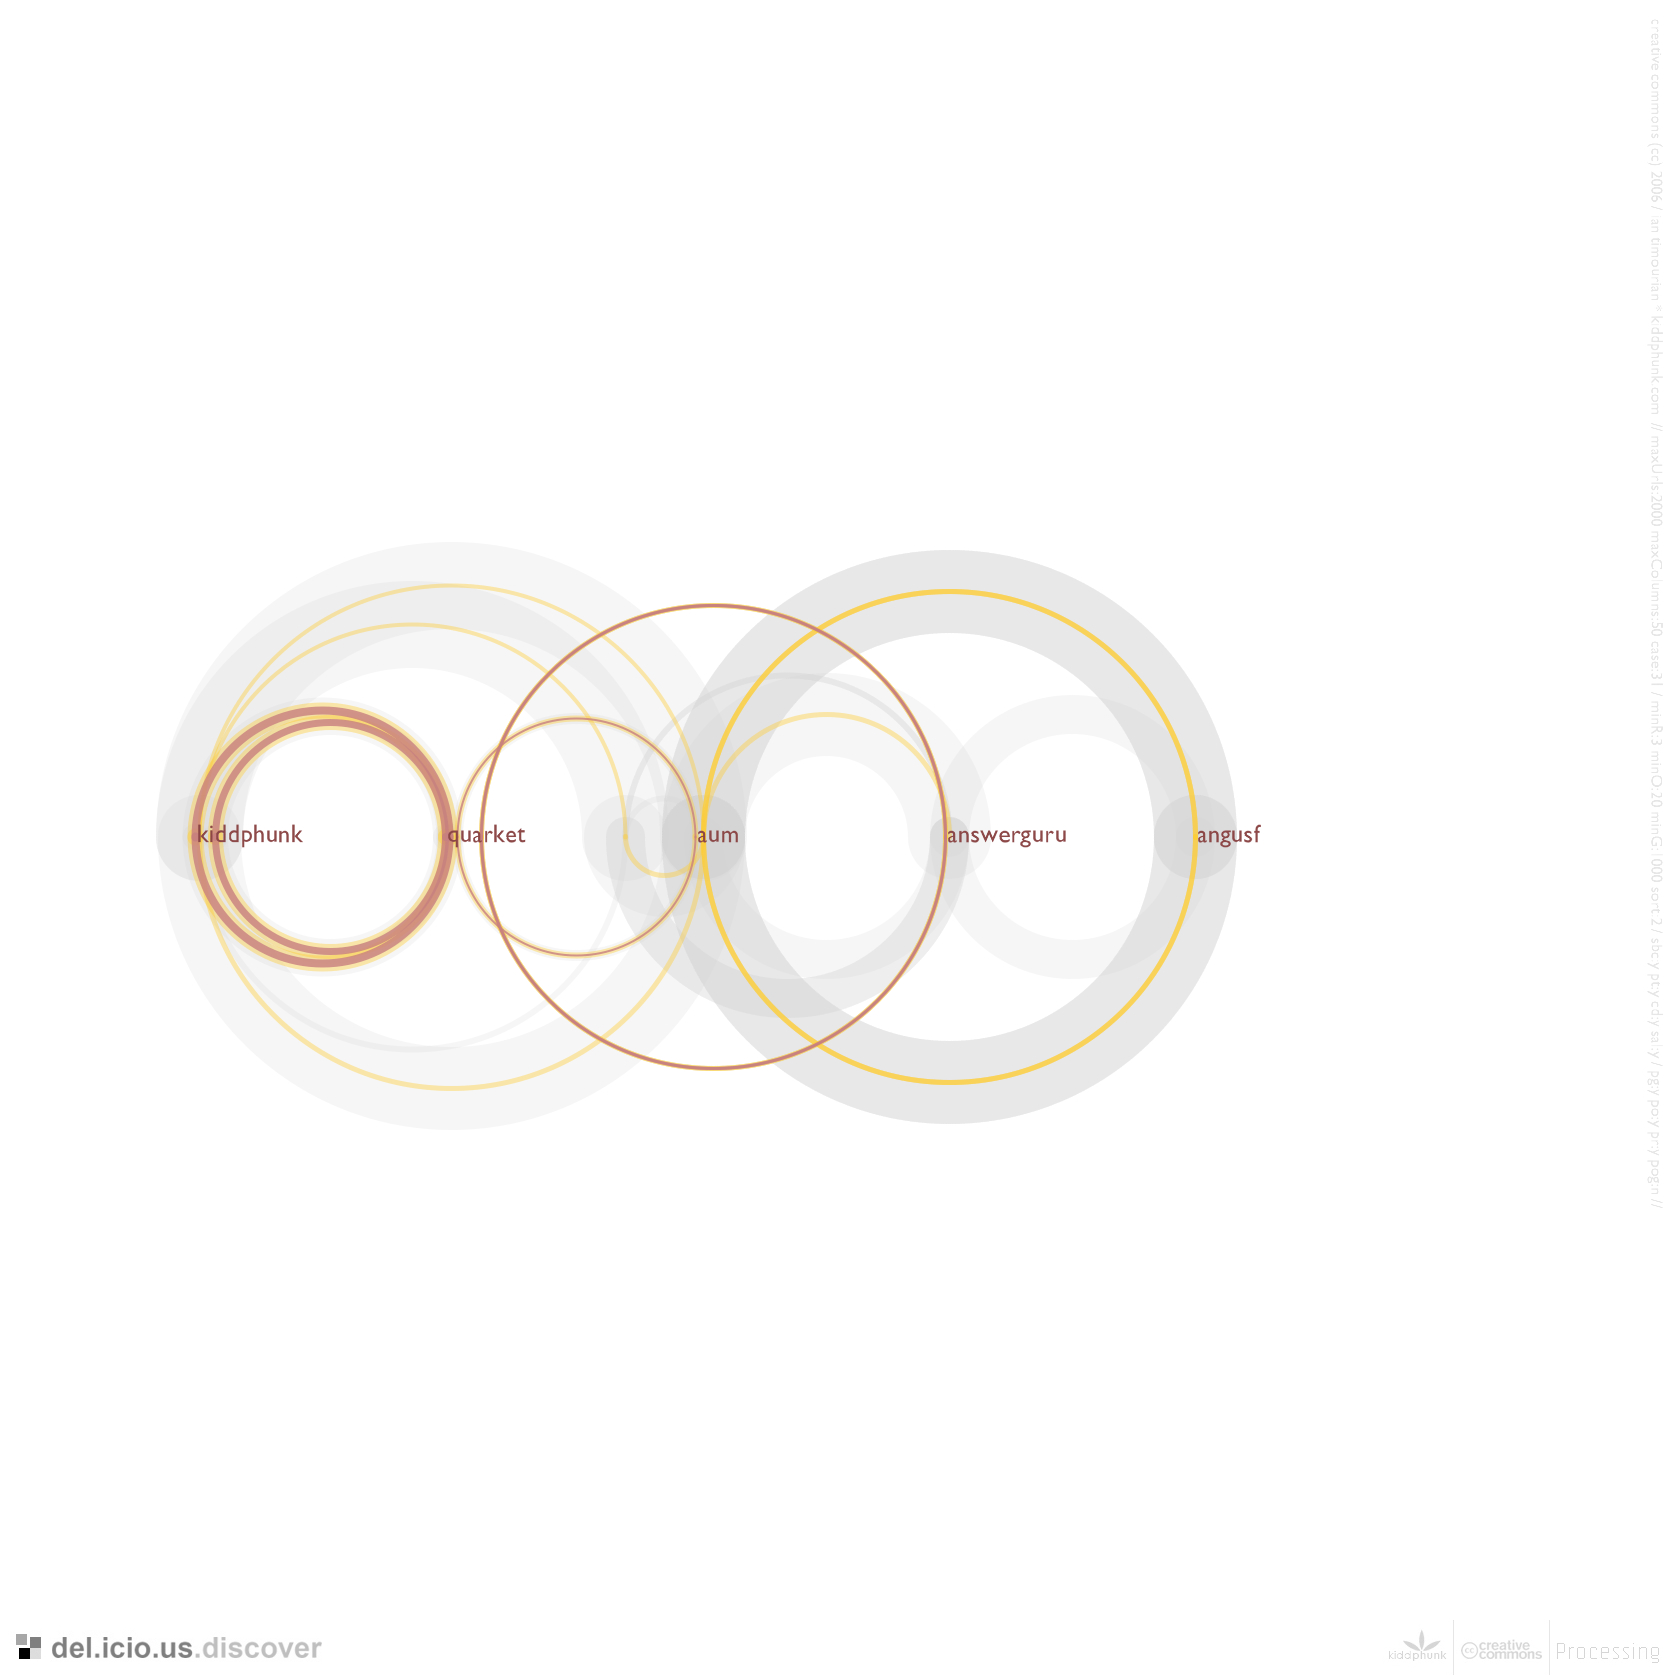 04.02
04.02 
 04.04
04.04 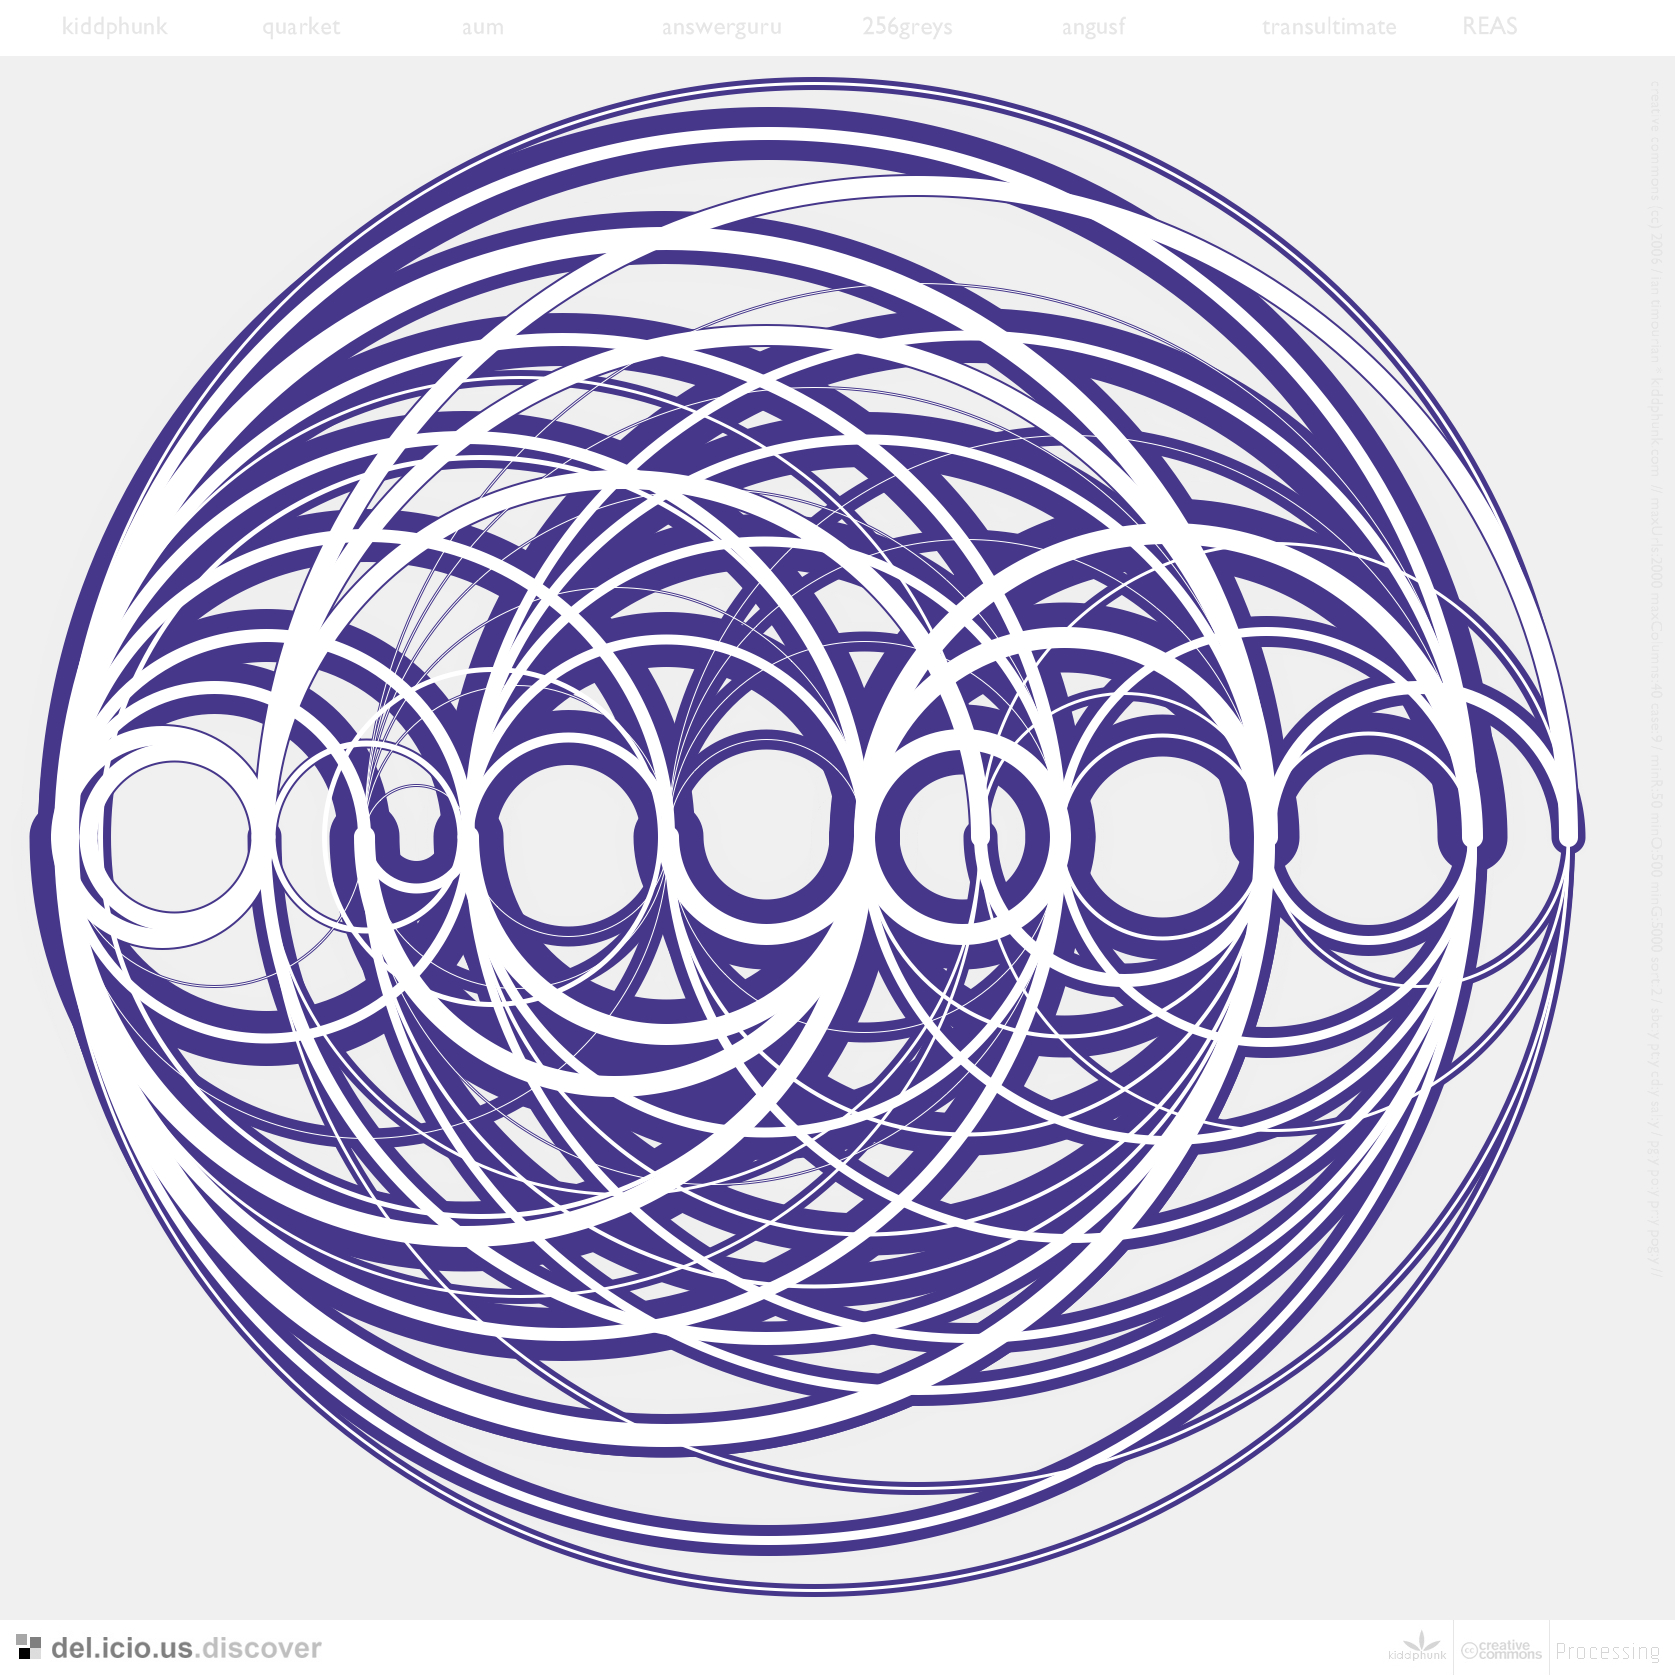
 04.06
04.06