| 01 | | | INTRO |
| 02 | | | GRAPHS |
| 03 | | | CONNECTIONS |
| 04 | | | ABSTRACTIONS |
| 05 | | | RECOMMENDATIONS |
| 06 | | | OUTTRO |
| 00 | » | beatspixelscodelife.com |
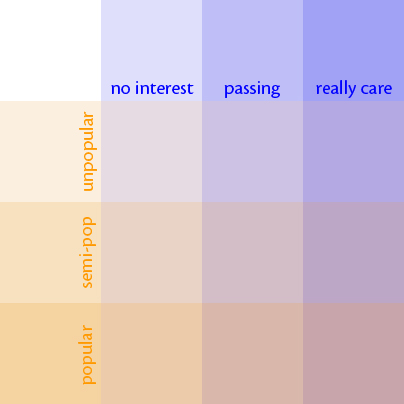 interest level vs. link popularity - 01.01
 01.02
01.02
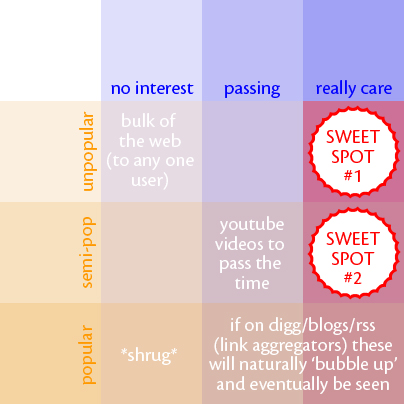 one user's interest level vs. link popularity - 01.03
For example, I used to keep a running collection of sites that featured visualizations of complex networks and interesting interfaces for browsing large sets of data, until I discovered visualcomplexity.com, a labor of love by Manuel Lima that "intends to be a unified resource space for anyone interested in the visualization of complex networks." Because of the narrow focus of the site, for me it has an extremely high signal-to-noise ratio, and I can read this "aggregate blog" through my RSS news-reader alongside other blogs, Basecamp project updates, del.icio.us inbox subscriptions, etc. and know that I have a wide coverage of visualization systems.
And when considering how we browse the web, there should also be a distinction drawn between various modalities. There are many, but three modes in particular are relevant here: "information retrieval" where one has a query or roughly knows what they are looking for, "show me whats new" where the aim is to get a feel for the 'news' (or a pulse of the current world vibe), and the "show me what I need to see right now" mode where one has a fixed amount of time allotted to bit-viewing yet is flexible as to the content. (Note of course that any one of these modes can cause a user to branch or split off into submodes and sub-queries, a complex, intertwined dance of information gathering.)
Generally speaking, I think the key shift is to begin to see, understand and utilize each other as these nodes/sources of aggregation, and continue to extend our tools and interfaces to facilitate our group-mind interaction.
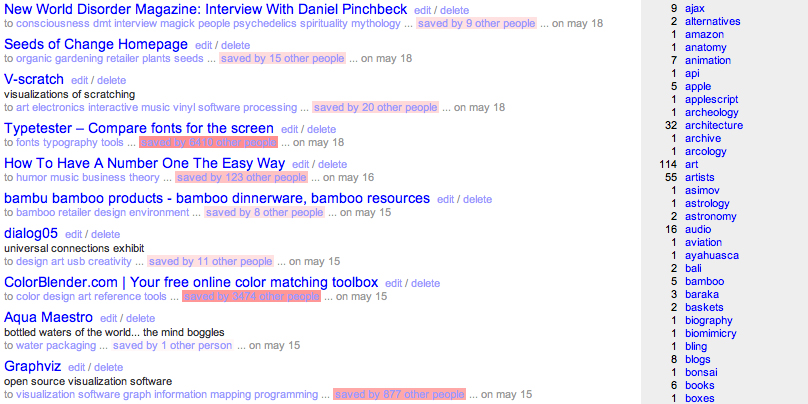
del.icio.us allows a user to subscribe to another user's book-mark stream. This is a great feature, but out of the thousands of users, how do we pick out the users with the highest (for us) signal-to-noise ratio? And how do we best utilize the disparity in link popularities, to find hidden nuggets of personally-relevant information that might otherwise be missed?
Continue on to part 02 | Graphs